
A NEW World Rugby report confirmed that this was most competitive Rugby World Cup and Fiji were the most successful team in winning opponents scrums.
The detailed report, compiled by World Rugby Game Analysis, details the trends behind New Zealand’s success in becoming the first team to defend successfully the Webb Ellis Cup. It also outlines why, through a return to attacking, positive play, rugby was the real winner during 44 days of compelling action across 13 venues the length and breadth of England and in Cardiff.
Key findings:
* RWC 2015 was the most competitive tournament to date with the lowest average winning margin of any previous tournament (22 points v 30 points in 2011)
* RWC 2015 saw the most competitive performances from tier two teams with two rankings upsets and the lowest average winning margin between tier one and tier two teams (31 points v 37 points in 2011)
* Southern hemisphere teams were more effective at scoring tries, accumulating 50 per cent more tries than penalty goals, while northern hemisphere teams scored 50 per cent more penalty goals than tries
* Tries continued to win matches and in more than 80 per cent of matches the team scoring the more tries won the match
* High-scoring defeats were dramatically reduced with 65 points the highest tally scored by a team in a match, making it just the 32nd highest in RWC history compared to 87 in 2011 and 145 in 1995, the largest defeat to date
* Tries were back in fashion with an average of five tries per match in the knockout stages and five tries in the final, which is the highest since Rugby World Cup 1987.
Emerging nations challenging the elite
One of the enduring and most celebrated highlights of the tournament was the performances of the likes of Japan, Namibia, Georgia and Romania, who inspired and captured hearts and minds with their superb performances across the pool phase with a fairer match schedule, longer preparation time and greater investment in technical structures major contributors.
* 30 per cent more tries were scored by tier two teams against tier one teams in 2015 than in 2011
* Tonga had more possession than their opponents in all four matches
* Japan and USA were the only teams that had a 100 per cent success on their own scrums
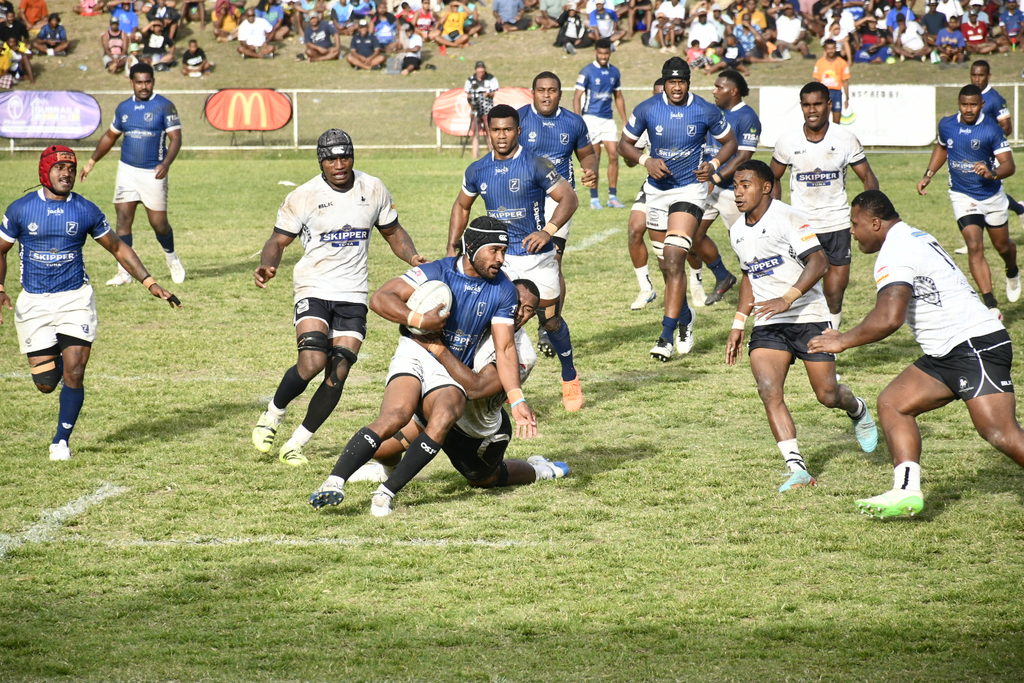
* Fiji were the most successful team in winning opponents scrums
* Namibia’s four tries from turnovers were exceeded by only two other teams
* Namibia also had the second most successful kick at goal rate
* New Zealand were worthy champions
* New Zealand scored more tries than their opponents in all seven matches
* New Zealand had a high scrum retention rate, losing only one of 38
* New Zealand’s ruck retention rate was the best of any team
* New Zealand scored 39 tries that originated from their own half, more than any other team
* New Zealand scored more tries from their own lineout than any other team, their most successful origin of tries and far greater than any other team
General game trends
The overall shape of the game has changed dramatically since the game went professional in 1995. The following shows how play has evolved since Rugby World Cup 1995 in South Africa.
* Ball in play has increased by 26 per cent to an average of 44 per cent per match
* Passes have increased by 40 per cent from 201 to 282
* Rucks have increased by nearly 90 per cent from 94 to 178
* Kicks have decreased from 59 to 39 per match
* Scrums have more than halved from 23 to 13 per game