
There is an old saying across the Pacific that everybody is a weatherman. You step out of your bure early morning, glance at the angle of the coconut fronds, look at the clouds in the sky, then also feel the humidity clinging to your skin, and instinctively know whether to grab an umbrella or prepare for a hot day.
Yet, behind every official weather bulletin, tropical cyclone warning, and agricultural advisory lies a quiet, precise army of instruments. Day and night, rain or shine, these mechanical and electronic sentinels stand watch across our islands and seas, translating the invisible moods of the atmosphere into hard numbers.
Over the coming weeks, this series will explore the complete toolkit of the weather, climate and atmospheric sciences. Across ten dedicated parts, we will examine wind instruments, rainfall, temperature and humidity, atmospheric pressure, upper-air observations, severe weather tracking, evaporation and soil moisture, solar radiation, sunshine, weather map plotting, analysis and weather forecasting, and weather variability and change issues.
Capturing the wind
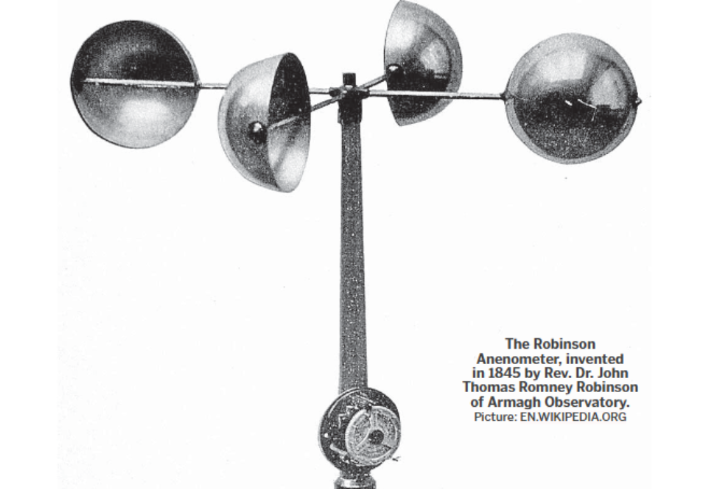
Wind is air in motion driven by pressure gradients, but measuring this invisible river requires clever physics. At the surface, wind vanes use aerodynamic drag to align with the flow, while cup anemometers measure speed as moving air creates differential pressure across hemispherical cups, spinning an internal generator.
During a tropical cyclone, wind behavior turns chaotic. Meteorologists distinguish between sustained averages and violent, sudden gusts caused by turbulence and downdraughts. To capture these extremes—and the fierce vertical wind profiles stretching into the upper air—forecasters rely on ruggedized surface sensors and radar-tracked pilot balloons, ensuring we understand the full mechanical fury of the storm before it makes landfall.
The seafarer’s legacy
Long before automated weather stations dotted our archipelagos, human survival relied entirely on reading the wind. Ancient Polynesian voyagers and early global navigators mastered the subtle shifts of the trade winds, ocean swells, and cloud structures to cross vast oceanic expanses. In the marine environment, wind is the primary driver of surface currents and wave generation.
Before mechanical anemometers were common, observers relied on empirical descriptive tools like the Beaufort scale, established by Admiral Sir Francis Beaufort in 1805. The scale originally graded winds from Force 0 (calm) to Force 12 (hurricane) based entirely on how a full-rigged Royal Navy ship reacted to the canvas.
Classic cup anemometers
At its core, the mechanical cup anemometer is a masterpiece of simple aerodynamic design. Typically consisting of three or four hemispherical cups mounted symmetrically on horizontal arms, it exploits the drag differential between the hollow concave face and the smooth convex back of the cups. When wind blows, the force exerted on the concave side is significantly greater than on the convex side, producing a net torque that rotates the central axis.
Modern calibration ensures that the rotational velocity is directly proportional to the true wind speed. For directional measurements, the companion wind vane utilizes a vertical fin design where aerodynamic pressure forces the tail downwind, aligning a potentiometer or digital encoder to yield precise directional degrees. Together, these surface tools provide the continuous baseline data essential for local forecasting and engineering design.
Probing the vertical
Surface measurements tell us only what is happening at ground level, but the atmosphere is a three-dimensional thermodynamic engine. To understand how weather systems develop, meteorologists must track winds aloft. This practice historically began with pilot balloons, or “pibals”—small, highly visible hydrogen- or helium-filled balloons released into the atmosphere.
As the balloon ascends at a predetermined, constant rate of ascent, observers track its precise trajectory using a specialized optical theodolite. By noting the azimuth and elevation angles at regular minute intervals, forecasters can apply trigonometry to compute wind speed and direction at successive altitude layers, revealing the steering currents that guide weather systems across the globe.
Radar and optical tracking
While visual tracking with an optical theodolite works well under clear skies, tropical skies are frequently choked with clouds, rain, and turbulence. To pierce through overcast conditions, meteorologists transitioned to radio-windfinding and radar tracking of upper-air targets.
Specialized radar reflective targets or small transponders attached to ascending balloons allow tracking equipment on the ground to monitor the balloon’s precise coordinates regardless of visibility. By continuously recording these spatial shifts over time, upper-air radar tracking calculates high-resolution wind profiles through the boundary layer and middle troposphere, supplying vital data streams for aviation safety and severe weather prediction.
The radiosonde era
The ultimate evolution of vertical sounding is the radiosonde—a battery-powered telemetry instrument package suspended beneath a weather balloon. As the balloon ascends through the troposphere and stratosphere, the radiosonde continuously measures ambient temperature, relative humidity, and barometric pressure, while its position is tracked via advanced navigation systems like GPS to derive exact upper-wind vectors.
Crucially, these wind measurements are mapped directly to standard isobaric pressure levels (such as the 850, 500, and 200 hPa surfaces). This alignment allows forecasters to visualize upper-level troughs, ridges, and jet streams on synoptic charts, providing the foundational 3D framework required for modern numerical weather prediction.
Aviation and wind shear
Wind data is not just for weather forecasting; it dictates the safety and economics of global aviation. Take-off and landing performance depend heavily on headwinds, which increase aerodynamic lift over the wings at lower ground speeds, shortening the required runway roll. Conversely, tailwinds require longer runways and stricter weight limits.
Near the surface, low-level wind shear—an abrupt, violent shift in wind speed or direction over a very short distance—presents a lethal hazard during final approach, threatening to instantly strip away aircraft lift. Ground-based anemometers and Doppler radar systems monitor these invisible traps, while airlines rely on accurate upper-wind forecasts to optimize flight paths, saving millions in jet fuel and keeping Pacific skies secure.
The synoptic view
Every isolated measurement collected by a cup anemometer, pilot balloon, or radiosonde serves as a vital data point in a global network. When transmitted via international telecommunication systems, these observations are assimilated into massive numerical weather prediction models run by meteorological centres worldwide.
These models process surface friction, Coriolis forces driven by Earth’s rotation, and pressure gradient inputs to simulate how global wind belts—such as the Hadley cells and mid-latitude westerlies—evolve over time. What begins as a local breeze rustling a backyard weather station ultimately contributes to the planetary-scale equations that forecast tomorrow’s weather and next season’s climate anomalies.
Climate tracking
Beyond day-to-day forecasting, continuous and consistent wind measurement is an indispensable pillar of climate science. Long-term observational archives allow climatologists to detect subtle shifts in regional wind patterns, monsoon intensities, and tropical cyclone climatology over decades.
As global temperatures rise and atmospheric circulation cells shift, tracking changes in surface wind speeds and upper-air jet stream behaviour helps scientists model future environmental impacts on sea levels, ocean mixing, and island ecosystems. Through meticulous instrumentation from the surface to the stratosphere, we ensure that the invisible story of the wind continues to guide our resilience in a changing world.