
Fiji is known as a family-friendly holiday destination particularly among young families.
It has natural beauty, rich cultural experiences, warm hospitality, less crowd, and wide range of luxury to economy accommodation.
It is a short-haul flight from its main markets of Australia and New Zealand.
Fiji’s post-pandemic tourism industry has strongly recovered.
In 2023, Fiji surpassed its previous record of 894,389 visitors by attracting 929,740 visitors, then did that again in 2024 with 982,389 short-term arrivals.
For the first nine months of this year, visitor arrivals were up from the 2024 levels and Fiji is poised to break the 990k visitor threshold by the end of this year.
Changing demographics
Fiji is seeing a change in the demography of its visitors.
Its traditional visitor segment has been young families.
People in the 1–14 years and 25–49 years cohorts accounted for 61.2 per cent of all arrivals in 2019.
But that percentage has steadily dropped to 58.6 per cent in 2024 and currently stands at 57.7 per cent (Figure 1).
At the same time, the number of visitors in the 65+ age group has been rising.
In 2019, this cohort reached 77,115 and accounted for 8.6 per cent of all short-term travellers.
At present, the number of visitors in the 65+ age group has reached 113,302 arrivals (on a moving annual total basis).
This is 11.5 per cent of total visitors (Figure 2), up 46.9 per cent on 2019 arrivals.
This cohort is the only age group that has been consistently rising in numbers since Fiji reopened its borders in late 2021.
It is now the highest of all age groups visiting Fiji, up from fourth in 2019 (Figure 1).
The other age groups have lost its growth momentum in recent months after increasing initially.
Most of the arrivals in the 65+ age group are couples as the number of male and female visitors in this cohort of short-term arrivals are about the same. And they are coming from Australia, New Zealand and the US.
Changing visitor demographics: what does it tell us
One inference we can draw from the changing visitor demography is that Fiji is perhaps getting expensive for families travelling with children. (Figure 5)
The daily spend of visitors has been higher since the pandemic
Some budget-conscious young families may be seeking more competitive destinations.
Visitor numbers to Cook Islands, Samoa and Vanuatu have picked up in recent years, and this suggests that leisure travellers in Fiji’s main markets are looking for a better value proposition, particularly in the face of the rising cost of living in the source countries.
We have also seen international holiday travellers from Fiji’s source markets return in growing numbers to their favoured Asian destinations such as the Philippines, Thailand, Vietnam and Indonesia in recent months.
Older cohorts have a higher propensity to consume leisure services.
This may be due in some cases to lower levels of personal debt (as they are more likely to have paid off their home loans) and improved financial security from home values and stock market prices.
Strong property price growth drives perceptions of increased future wealth perhaps leading to less savings of their income.
So far, Fiji’s annual total tourism earnings are holding comfortably above FJD2bn.
Another inference we can draw is that it may be possible that Fiji is benefitting from multigenerational travel where senior members of the family travel with members of different generations.
So, Fiji may be wise to put in place strategies to attract more of its traditional customer base (young families).
As we discussed in a previous article, addressing the shortage of rooms available would make Fiji’s accommodation prices more competitive particularly for school holiday travel and underwrite future tourism growth for Fiji.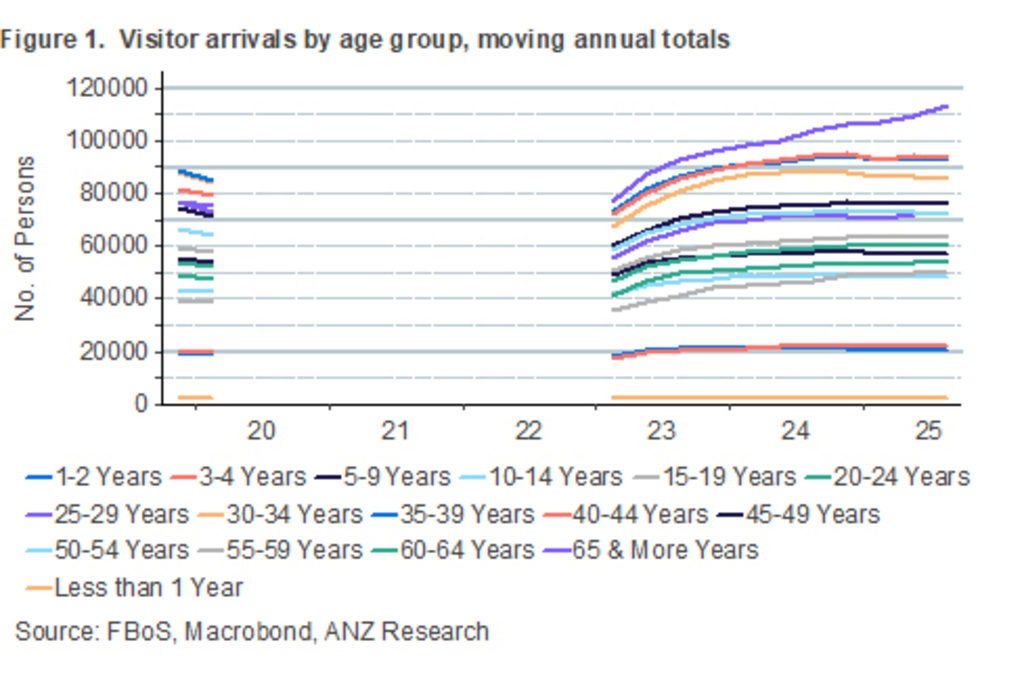
Figure 1: Visitor arrivals by age group, moving annual totals.
Image: SUPPLIED
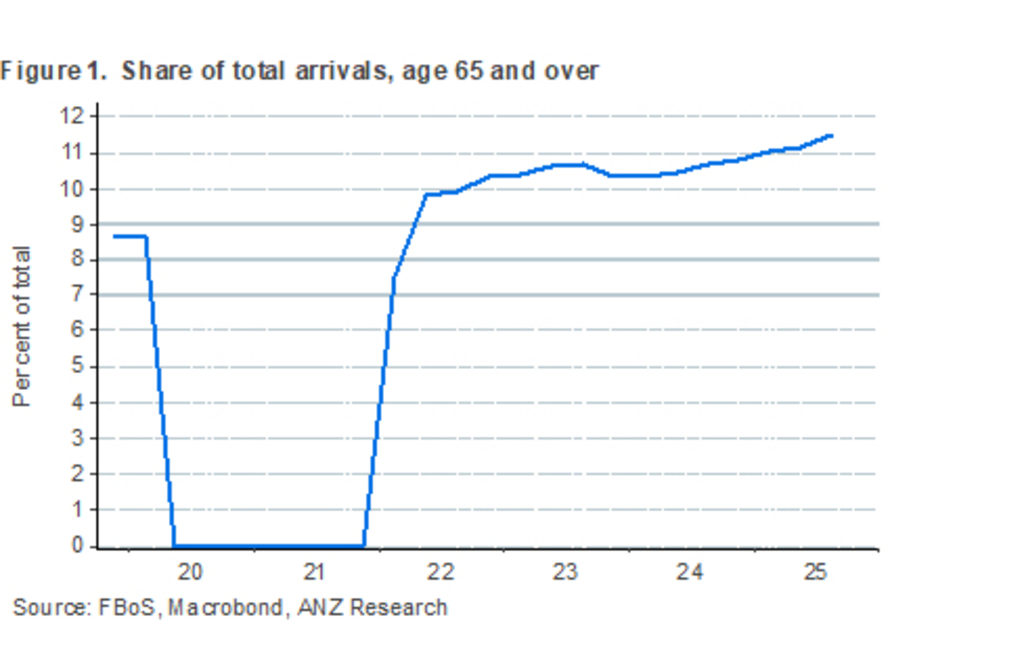
Figure 2: Share of total arrivals, age 65 and over. Image: SUPPLIED
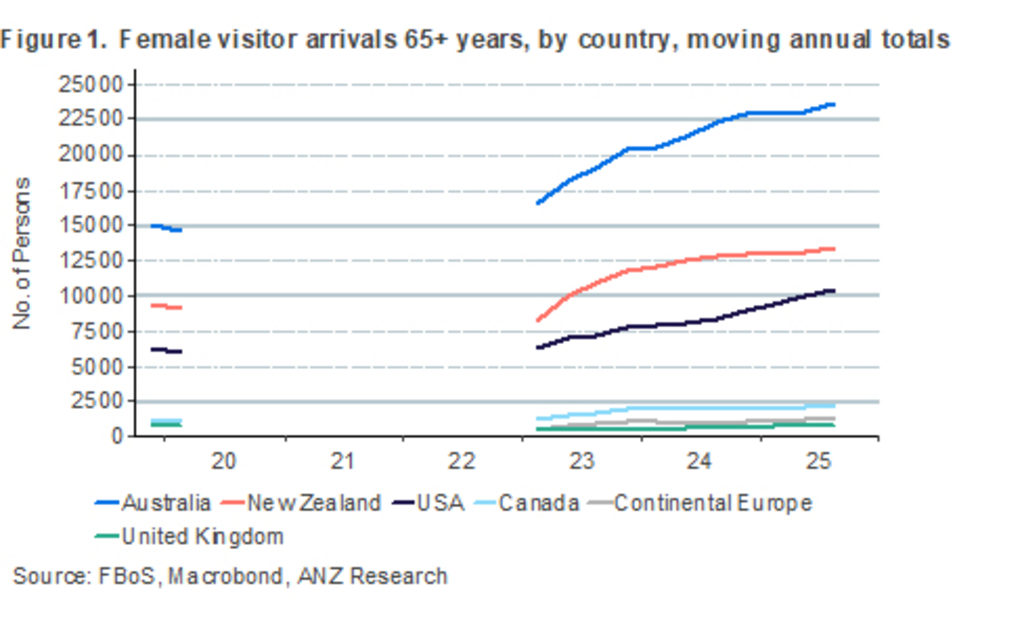
Figure 3: Figure 3. Female visitor arrivals 65+ years, by country, moving annual totals. Image: SUPPLIED

Figure 4: Figure 4. Male visitor arrivals, 65+ years, by country, moving annual totals. Image: SUPPLIED
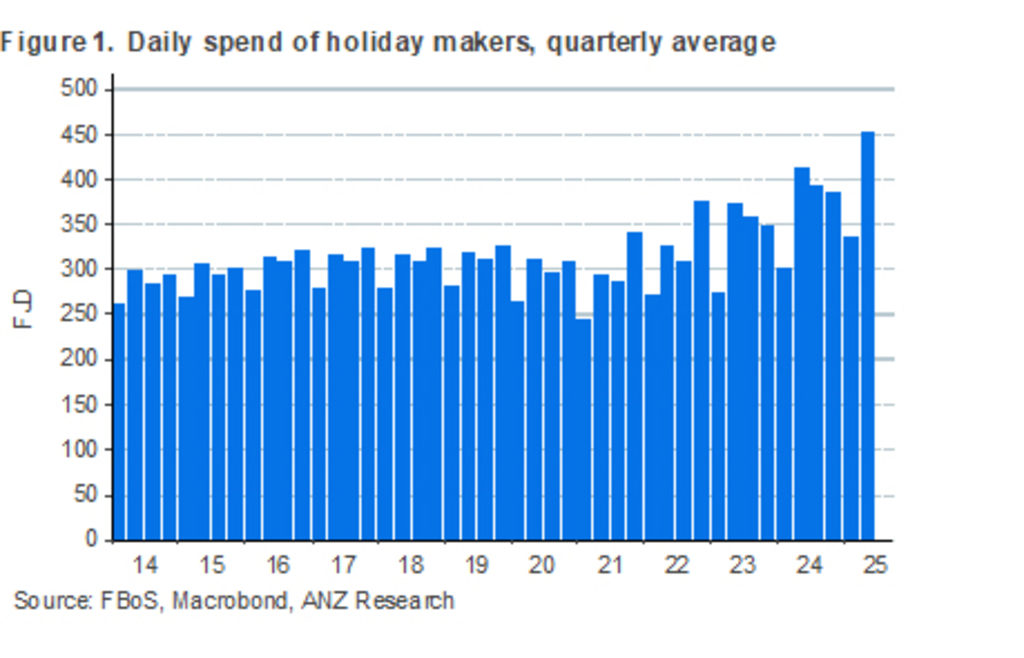
Figure 5: Daily spend of holiday makers, quarterly average.
Image: SUPPLIED
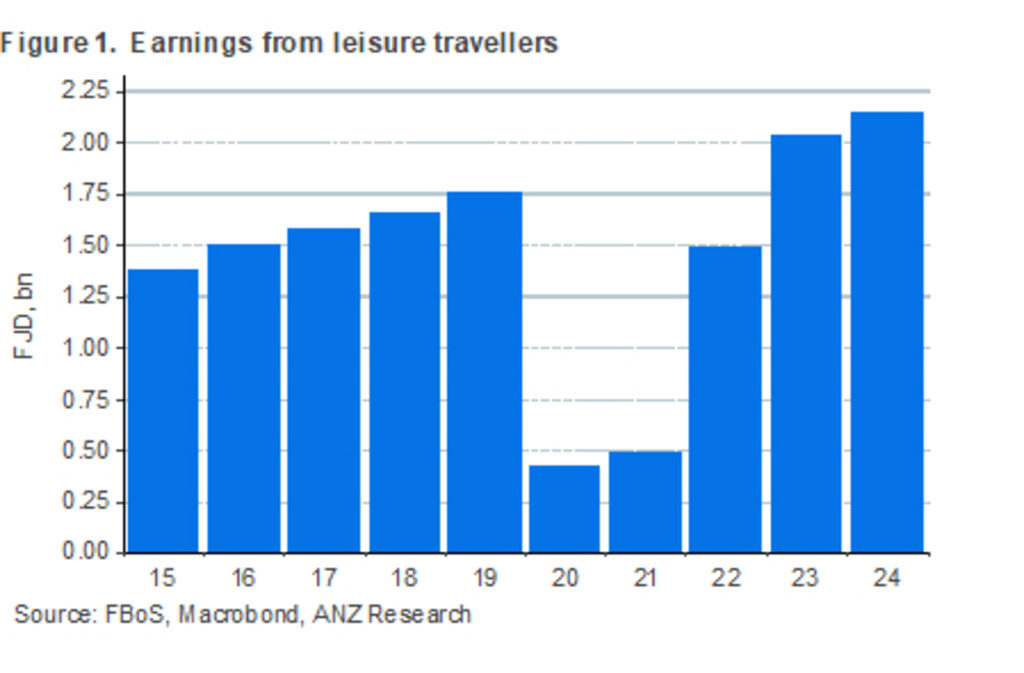
Figure 6: Figure 6. Earnings from leisure travellers. Image: SUPPLIED